
A Seat at the Table: A Chance to be Transparent
Defining the space: EdTech Data is information about student learning, behavior, and aptitude (social, emotional, and cognitive competency) derived from educational technology, usually in the form of learning analytics, performance-based assessments or games.
Research Question: How is EdTech data being used to inform practice, policy, or decision making?
Team: Abiraahmi Shakar, Samantha Rodgers
My Role: UX Research and Design Generalist
UX Research | UX Design | Prototyping | Product Development
Abiraahmi’s Initial Inspiration


Secondary Research
The secondary research conducted informed us of the many ways EdTech data is being harnessed towards improving learning and educational outcomes. Some organizations found that sharing data and findings beyond those directly impacted to stakeholders such as the wider community helped address issues in schools such as chronic absenteeism (Patnoudes, 2014; Patterson, 2016). Chana Edmond-Verley, one of the community outreach leads in one such initiative said, “You got the grandmother on the porch, you got the business, you got the police, and everybody is lifting up our kids and pointing the way” (Patterson, 2016). This aligns well with the theoretical reasoning of community-based participatory approaches to research, which advocates for integrating community members and their voice throughout the research process (Kapitan et al., 2011; Travers, 1997). While many sources pointed to net positive uses of EdTech data, many others also pointed to dangerous ones, including but not limited to the sale of data to advertising agencies so they can target students in colleges and universities (Feathers, 2022). In addition to issues relative to the sensitive nature of EdTech data (such as confidentiality breaching), our secondary research also flagged the lack of cohesion and standardization within education systems, messy data, and compliance and legislative barriers (Cruz, 2021; Feathers, 2022; Ramanujum, 2020).
Stakeholder Mapping
Interview Insights
We conducted interviews with 8 interviewees, from educators to educational app developers. After analyzing the interview notes/transcripts using affinity mapping, we found the following main insights:
Lack of Data Skills: Practitioners often lack the skills to interpret and analyze the data they are collecting. When educators do not understand the data, its meaningfulness and ability to be used in decision-making diminishes.
Assessment Error: The assessment data itself is riddled with error, from teacher motivation (when teachers know that the data is being used for evaluative/promotion purposes) to assessments failing to capture nuances in the domain of assessment (for speech assessments, for example, assessments may fail to identify when children have speech-related issues versus language-related issues). This leads to inaccurate data.
Apprehension Towards “Data”: Multiple stakeholders expressed a general feeling of hesitancy when it comes to collecting and sharing data. While teachers see the value in collecting data, they are often uncomfortable with who is using the data and how they are using it. Application developers and funders are aware of this apprehension, which leads to a decrease in talking about it, even when extra precautions are being taken to ensure compliance and data protection.
Brainstorming: Apprehension Towards “Data”
Our team decided to pursue designing a solution for apprehension towards data as this theme appeared most often throughout interview transcripts and appeared to be at the foundation of why various groups were not using edTech data to its full potential.

Initial Prototype
A communication tool in the form of a dashboard showing different perspectives, providing the user with increased visibility into how data is being used and by whom.

Feedback, Problem Statement, & Proposed Solution
After testing our initial prototype with multiple stakeholders, we received feedback which led to a few design changes. First, one of our subject matter experts told us to “design a for-profit product, even for non-profit work.” Second, we were told we should hone in on a specific context and solution and propose a tailored solution first before working to make a flexible product for multiple organizations. Third, we were encouraged to look again at the issue of a lack of data skills amongst stakeholders. Lastly, it was suggested that our product use blockchain technology.
We determined the first three suggestions made sense to pursue, but decided to table the blockchain suggestion as we do not currently understand our stakeholder’s attitudes and perceptions towards blockchain, which would be critical before introducing it as part of our product. From this feedback, we created a problem statement and proposed solution.
Problem Statement: Users and stakeholders of educational technology acknowledge the value of using data to make informed decisions about improving children’s learning. The use of data towards this purpose, however, is barred by a few significant barriers, two of them being:
a general apprehensiveness towards data due to a lack of transparency in how the data is processed and disseminated
a lack of understanding in how to use data to make the appropriate decisions
Proposed Solution:
A data dashboard to increase transparency in how data is being shared to various stakeholders
A card deck to encourage conversations about how different stakeholders use and apply data to support their thinking and decision making
Prototype Iterations
The data dashboard provides different levels of access to stakeholders depending on how meaningful it is to share that data across the various levels. For example, a government interested in identifying which schools might need additional funding for a program would be provided with grade level data and school level data, but not student level data.
The card deck would be used as part of training within a school setting meant to spark conversations around who should have which level of access to data and to what purposes each stakeholder will be using said data.


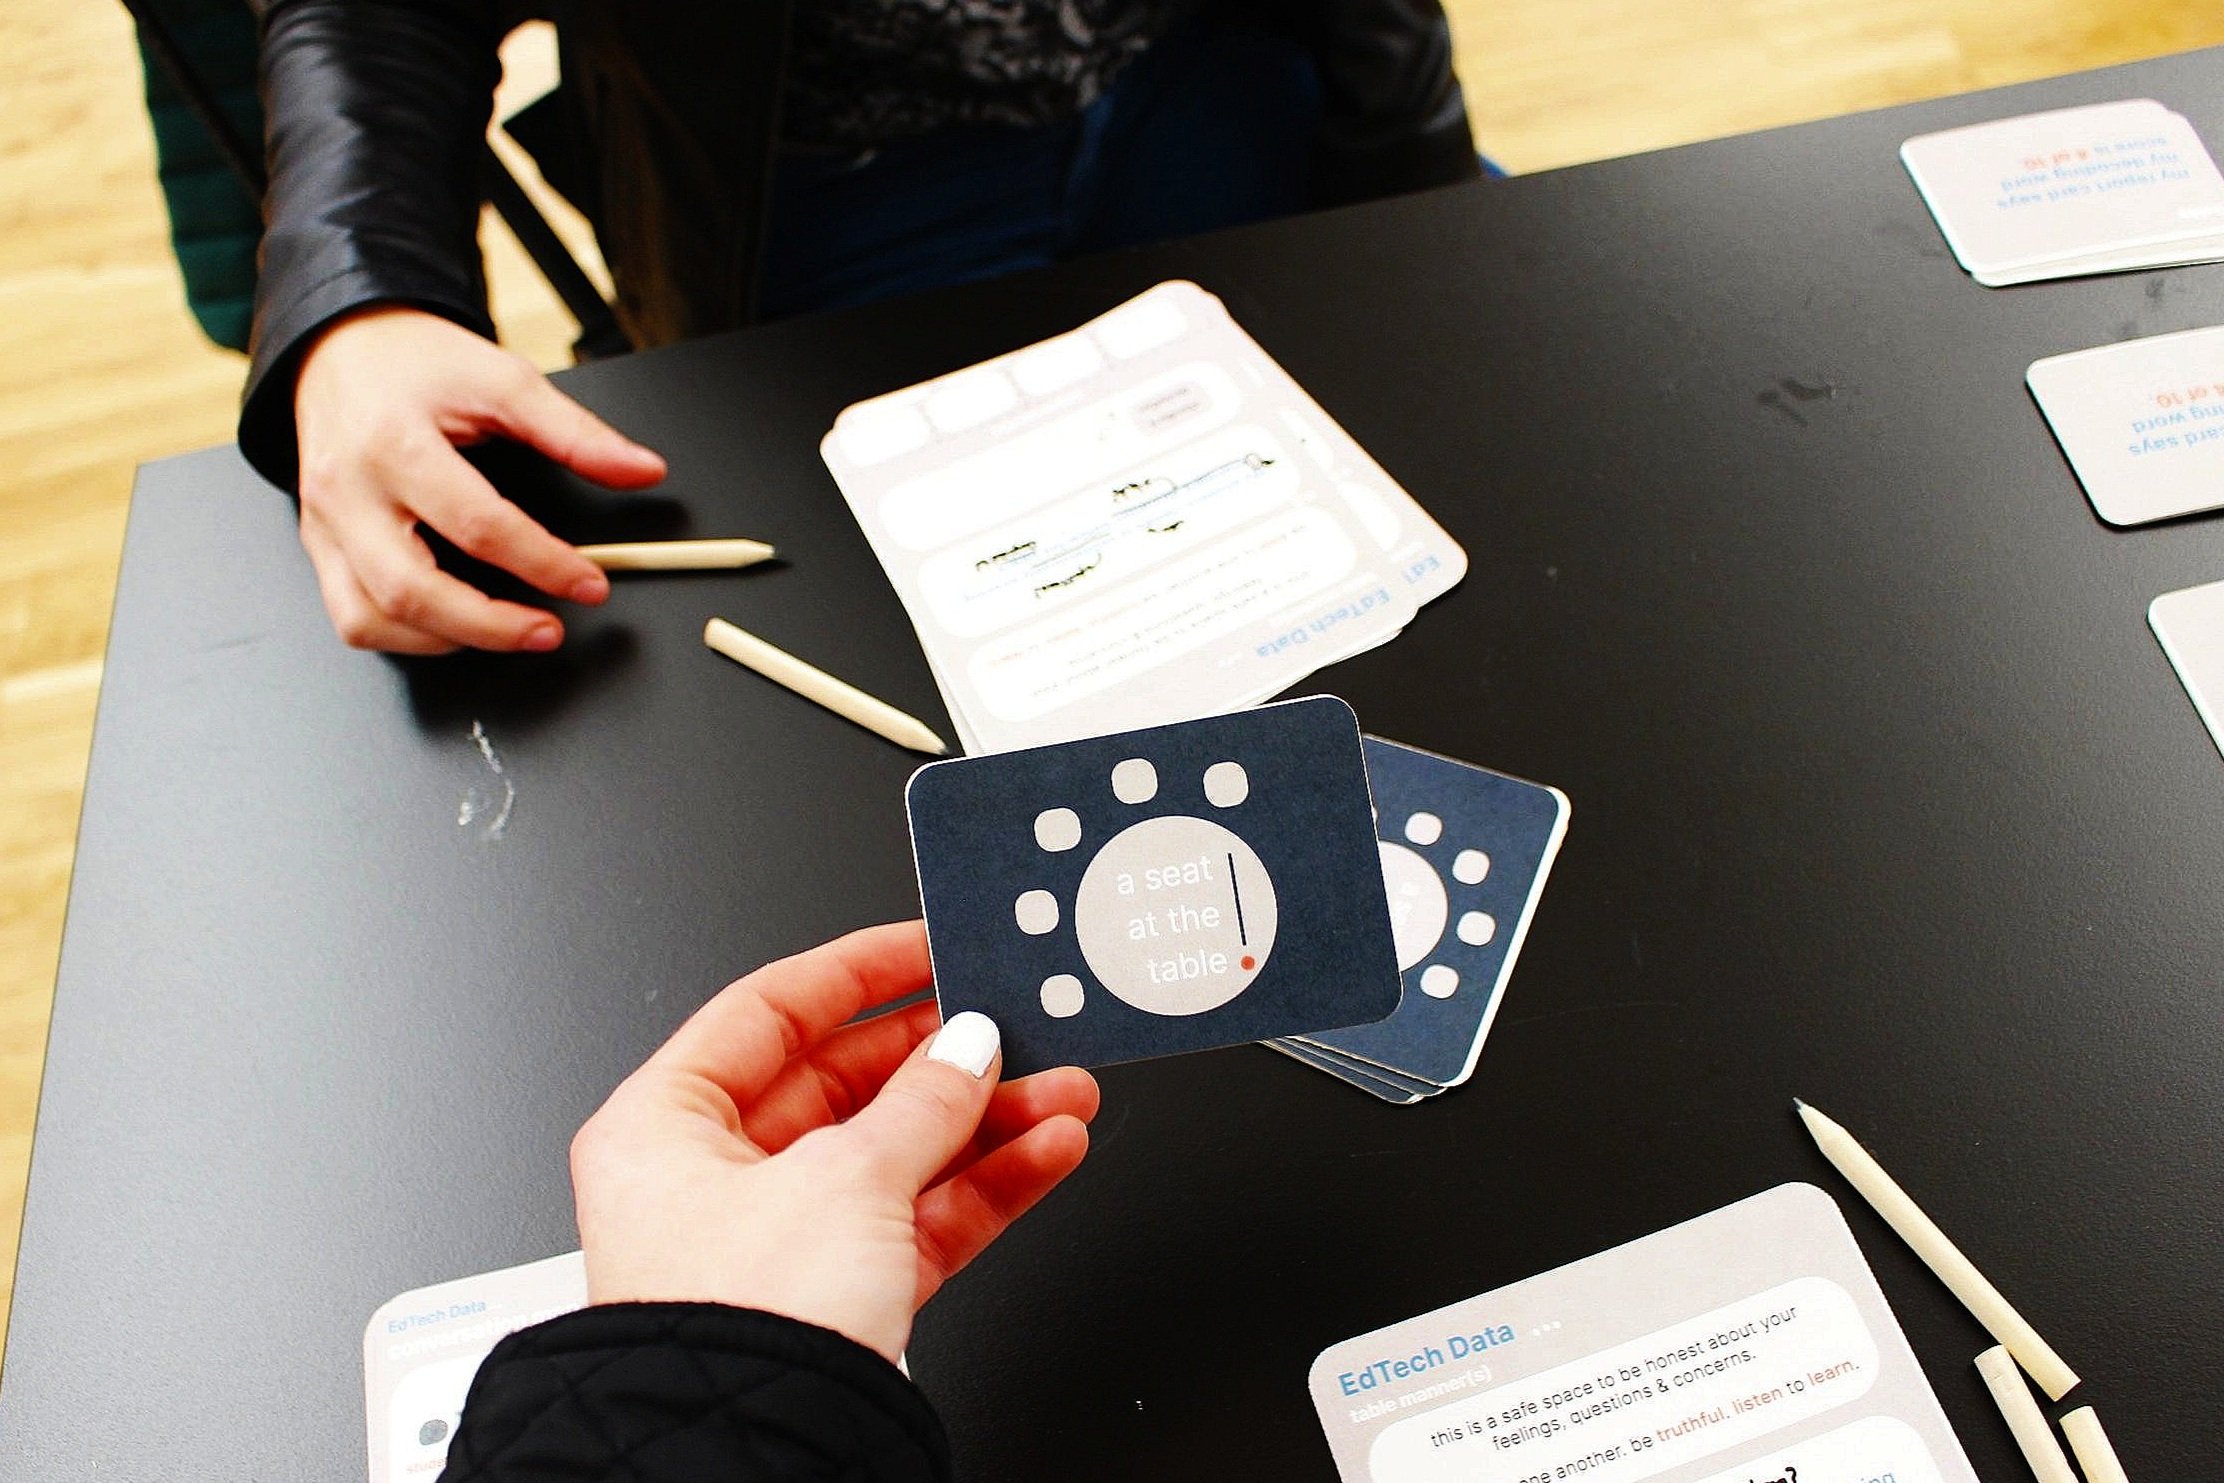
Final Product
After further feedback in user testing, we found out that some stakeholders may have apprehension towards how data is being used due to a lack of data literacy skills, which meant that one of the most valuable aspects of our product is the potential for a conversation amongst teachers and other stakeholders about data literacy and data usage within decision making. From this feedback, we focused on developing our card deck further.
Our card deck is a training tool that can be used to establish shared language and values around data being collected in educational settings with the goal of increasing data literacy, reducing apprehensiveness towards data, and increasing the usage of data to inform decision making. Our final card deck presents a piece of data without defining a solution, so as to encourage a healthy conversation around what the same piece of data means to the various stakeholders at the table.


